
On the cover: Davide Sbardella and Triomphe van Schuttershof over a 1.40 m fence at the CSIO Linz, May 2017. The results sheet prints both their names. Photo by Isiwal, CC BY-SA 4.0.

In the last post I spent a week trying to work out whether one startup’s model really was as well calibrated as its launch post claimed. The vendor had numbers. Two outsiders had rather different numbers. And I came out of that week trusting the outsiders a little more, mostly because they published what they ran.
That is roughly where model evaluation sits now. Every launch arrives with a bar chart, and every bar chart is somebody’s home fixture.
Here is the thing that made me want to write this one. A paper out this month reported that on one agent benchmark, a plain script with no language model inside it at all scored 96.8 out of 100, against 97.5 for the best real agent. The scorer had been marking the shape of the answer rather than the answer itself, so anything that produced well-formed output passed.
Welcome to the era of agentic benchmarks. This is the story of what those scores actually measure, which turns out to be a model and the code driving it, glued into one number that nobody can pull apart.
The horse show
I want you to think about a horse show. Two classes run on the same afternoon, in the same arena, for the same prize money.
The first is a dressage test. Its sheet is published weeks in advance: enter at A, working trot, twenty-metre circle at B, medium walk, down a list of about twenty movements. Every rider has that sheet and drills it at home. A ground jury sits around the arena and marks each movement out of 10.
The second is a show jumping class. The course designer builds ten fences that morning, and nobody has jumped them before. The rider walks the course on foot, counting strides and deciding where to turn. The horse meets the fences at a canter, having never seen them. There is a time allowed, four faults for a pole down, and three refusals sends you home.
Now here is the bit that runs the rest of this post. The results sheet for that jumping class prints two names, the rider’s and the horse’s, because the same horse goes round very differently under a different rider. Map it across, and hold on to these three:
- The horse is the model.
- The rider is the scaffold: the code wrapped around the model that decides what to do next, calls the tools, reads what came back, retries the failures and decides when to stop.
- The course designer writes the benchmark, the ground jury scores it, and the footing is the environment it all runs in.
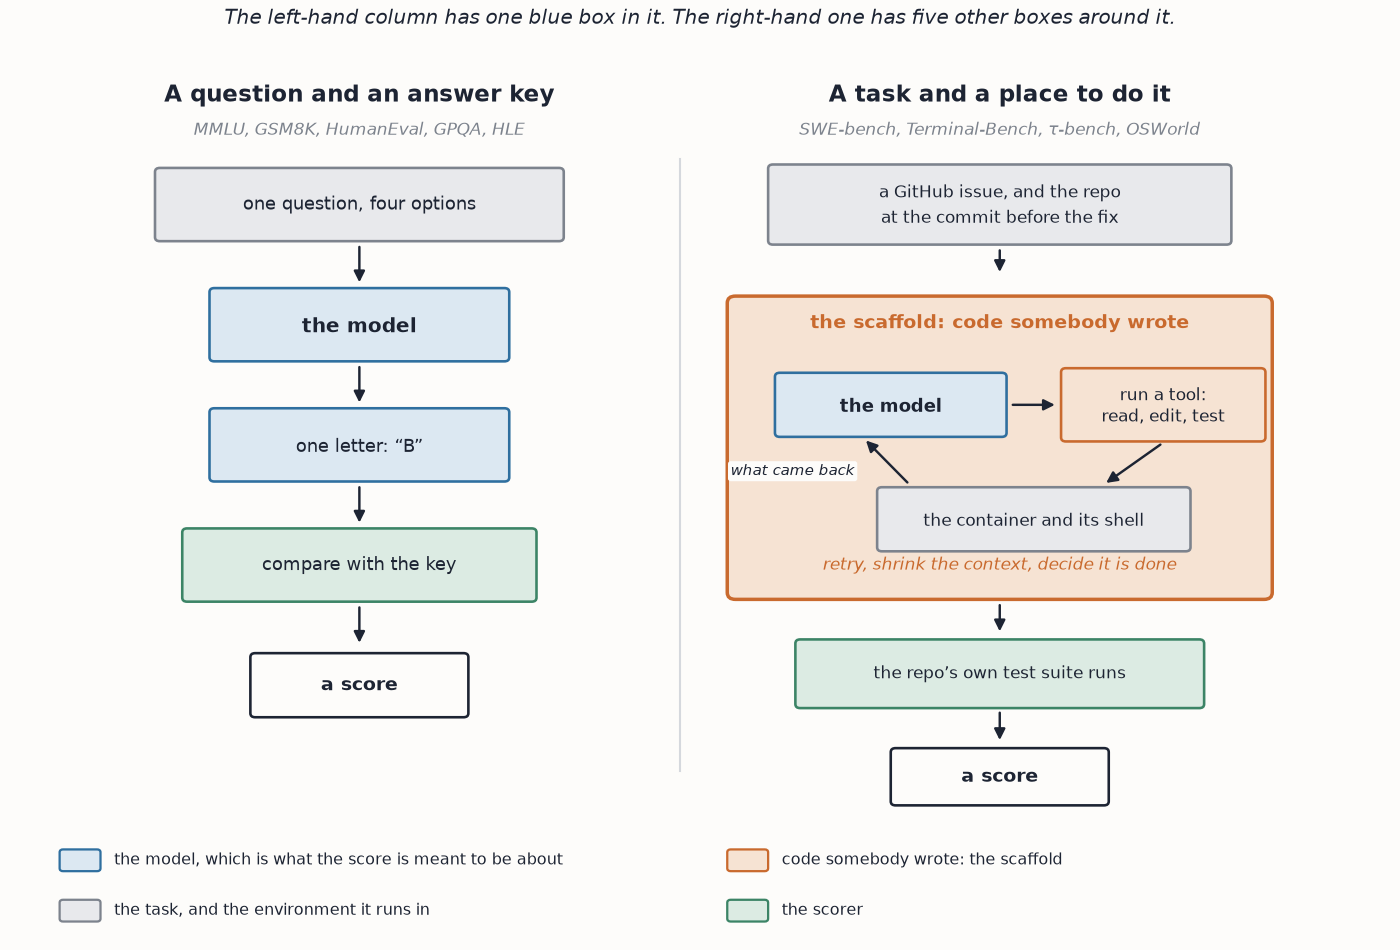 Figure 1: a static benchmark and an agentic one, drawn to the same scale. Blue is the model, orange is code somebody wrote, grey is the environment, green is the scorer. Source: Author
Everybody is getting full marks
MMLU, for massive multitask language understanding, landed in 2020: 15,908 multiple-choice questions across 57 subjects, from elementary mathematics to professional law, four options each. Guessing scores 25%. The best model in that paper was GPT-3 with a few examples in the prompt, and it managed 43.9%. For four years it was the number everybody quoted, because it was genuinely hard.
By early 2026 every frontier system, meaning the biggest and newest models from the big labs, reports above 92% on it, and the top few sit inside a point and a half of each other.
The same thing happened to the other two famous ones. GSM8K is 8,500 grade-school word problems, the dataset the GRPO post leaned on for its answer key, and it is finished. HumanEval is 164 small Python functions with hidden tests, and frontier models now pass 96 to 98% of them first time.
So why not just keep climbing? Because the top of these scales is mostly noise. A 2024 re-annotation called Are We Done with MMLU? put experts back over the questions and found that 6.49% of them contain errors: two correct answers, unclear wording, or a key that is simply wrong. The virology subset was the worst, with 57% of its questions flagged.
Let’s do the arithmetic, because it is the whole argument of this section. MMLU’s test split is about 14,000 questions. 6.49% of that is roughly 910 questions a careful expert would throw out. Meanwhile one percentage point of score is 140 questions. So the gap between first and second place, which is about a point and a half these days, is 210 questions.
Now you might reasonably say that every model sits the same 910 bad questions, so the damage cancels out and the gap survives. It would, if a broken question hurt everybody by the same amount. But a question with a wrong key rewards whichever model happens to share the mistake. And a question with two right answers rewards whoever picks the one the key likes. So this is not a constant offset, it is noise, and there are 910 questions’ worth of it sitting under a 210-question gap.
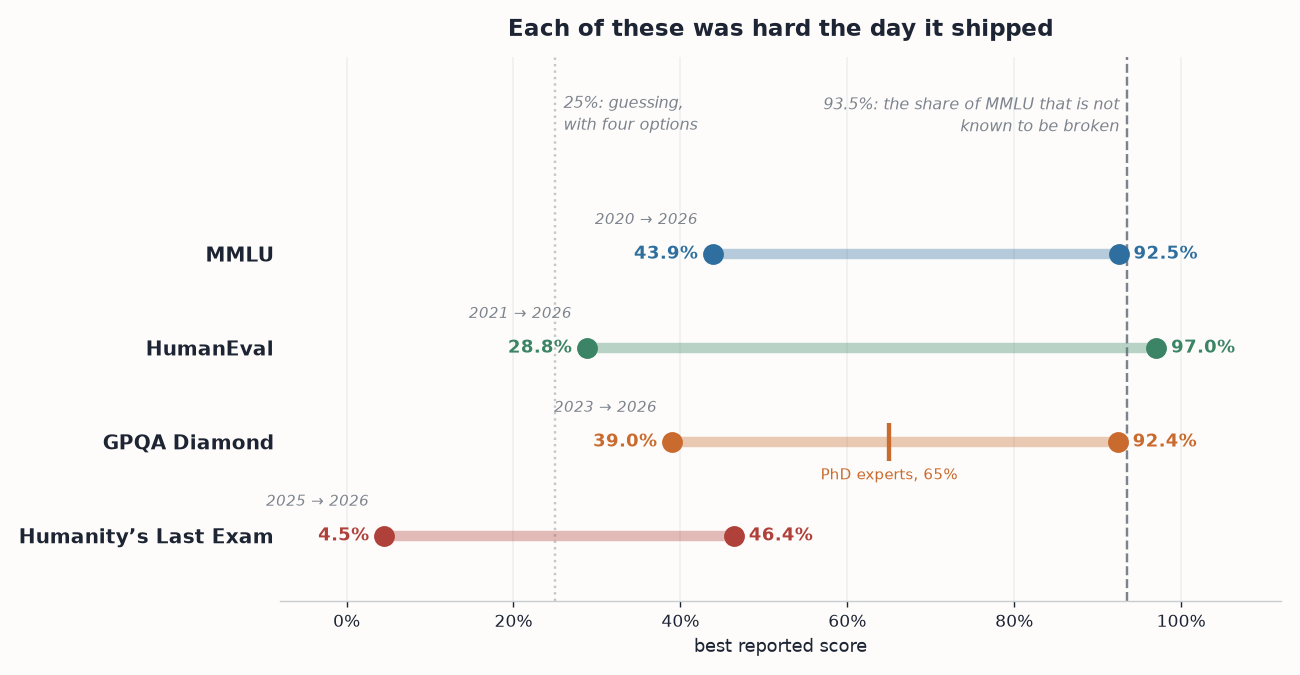 Figure 2: each row is one benchmark, from the best score the day it shipped to the best score now. The dashed line marks the 93.5% of MMLU that is not known to be broken. A model can still score on a bad question, so this is not a hard ceiling; it is the point past which most of what separates two models is questions nobody can grade reliably. Source: Author
When the test sheet is published in advance
Dressage sheets are public on purpose, and drilling them is the sport. Nobody minds, because the horse still has to do the movements in front of three judges.
A language model’s test sheet goes public by accident, and the drilling happens inside the training data. This is contamination: the benchmark’s questions, or near-copies of them, end up in the pile the model was trained on. Then the score is measuring memory rather than skill, and from the outside you cannot tell which one you are looking at.
Scale AI ran the cleanest test of this I know about. For A Careful Examination of LLM Performance on Grade School Arithmetic they wrote 1,000 brand-new problems by hand, matched to GSM8K’s style and difficulty, with no model involved. They called it GSM1k, and re-scored everybody.
Some model families dropped by up to 13 points. Phi, Mistral and parts of Llama fell, while Gemini, GPT and Claude barely moved. And there was a clean signal for it. The more likely a model was to spit out a verbatim GSM8K problem when prompted, the further it fell, with a Spearman $r^2$ of 0.36 between the two. That is a real relationship rather than a tight one. So for those families, a good chunk of what GSM8K measured was how well they remembered GSM8K.
Making the fences bigger
When a whole class goes clear, the course designer does not congratulate everybody. He raises the fences for next month. Benchmark authors did the same thing three times over.
MMLU-Pro (2024) keeps the format and makes it hurt: 12,032 questions, ten options rather than four, and more of them needing several steps. GPT-4o went from 88.7% on MMLU to 72.6% here.
GPQA (2023) is 448 graduate-level science questions, and its Diamond subset is the hardest 198. A question only gets in if two PhD validators in that field both answered it correctly, and fewer than one in three skilled non-experts did, even with the whole internet and half an hour each. PhD experts score 65%, the non-experts 34%, and models are now above 92%. Careful with that comparison, though: the questions were chosen for being ones experts get right.
Humanity’s Last Exam (2025) is 2,500 questions across more than a hundred subjects, written and vetted by specialists. At launch the frontier scored under 5%. By August 2026 the top entry is in the mid-40s.
| test | year | what it asks for | where it sits now | what it can still tell you |
|---|---|---|---|---|
| MMLU | 2020 | one of four options, 57 subjects | above 92%, top few inside 1.5 points | whether a cheap model is broken |
| GSM8K | 2021 | grade-school word problems | done | nothing |
| HumanEval | 2021 | 164 small Python functions | 96 to 98% | nothing |
| GPQA Diamond | 2023 | 198 PhD-level science questions | above 92% | very little, now |
| MMLU-Pro | 2024 | one of ten options, several steps | mid-80s | a little ordering near the top |
| HLE | 2025 | 2,500 specialist questions | mid-40s | real ordering, for the moment |
Eighteen months to get there is the fastest any of these has been climbed, and HLE is the hardest sheet anybody has written.
Asking the crowd instead
There is a second way to score, and it needs no answer key. On LMArena, formerly Chatbot Arena, you type a prompt, get two anonymous answers side by side, and vote for one. Those votes are fitted into a rating with the Bradley-Terry model, the engine underneath the Elo numbers from the AlphaZero post. Each model gets one strength number, and its chance of winning a match is its share of the two:
\[P(A \succ B) = \frac{e^{r_A}}{e^{r_A} + e^{r_B}} = \frac{1}{1 + e^{-(r_A - r_B)}}\]where $r_A$ and $r_B$ are the two models’ fitted ratings, and the exponential keeps the strengths positive whatever those ratings are. Choose the $r$ values that best explain the votes, and you have a leaderboard.
This is the dressage judging problem. Judges see the same movement from different angles, and they mark a horse they recognise a little more kindly. The Leaderboard Illusion audited two million arena battles, 42 providers and 243 models between January 2024 and April 2025. A small set of favoured providers were allowed to test many private variants and publish only the best one. At the extreme, one of them ran 27 variants before releasing the one that landed at number two. The top two providers had received an estimated 19.2% and 20.4% of all votes cast, and 83 open-weight providers were quietly dropped off the board.
And that access is worth something you can measure. Raising the share of arena data in a model’s training mix from 0% to 70% took its win rate on ArenaHard from 23.5% to 49.9%.
The jump-off
Everything above is a dressage test. You hand the model a question and mark what it writes back.
The benchmarks people actually argue about in 2026 hand over the keys instead. They give the model a task, a terminal and a browser, and then they leave it alone with them.
- SWE-bench (2023) gives an agent a real GitHub issue and the repository at the commit before the fix, then grades its 2,294 tasks with the project’s own test suite. SWE-bench Verified is the 500-task subset OpenAI paid humans to check, because many issues were under-specified and many tests so narrow that a good fix still failed them.
- Terminal-Bench (2025) is 89 hard tasks in a container with a shell: systems administration, cryptography, porting scientific Python, even modernising COBOL.
- τ-bench (2024) is customer service. A simulated user asks for a refund or a flight change, and the agent holds a conversation while making tool calls against a database, following a written company policy.
- OSWorld (2024) sits the agent in front of a real desktop: 369 tasks, graded by scripts that check the actual file or setting afterwards. Humans manage 72.36%, and about 8% are impossible on purpose, to see whether the agent notices.
- METR’s time horizon reports no pass rate at all. It reports a length of task: the human-time duration at which a model succeeds half the time. That has doubled about every seven months since 2019, and METR’s 2026 update puts it at 196 days.
Every one of those five needs a rider.
Nobody is scoring the horse
A model cannot open a file. It produces text, and that is the whole list. Something else has to read the issue, pick the files worth looking at and run the tests. Then it has to notice the traceback, decide whether that is worth another go, and call the patch done. That something else is the scaffold (the rider), and it is real software with real judgement calls in it.
So how much of a published agent score belongs to the scaffold? A paper this month went and measured it. Coding Agents Have Converged pulled the SWE-bench Verified leaderboard apart by model and by scaffold. For models run under at least two different scaffolds, the median spread was 15.6 percentage points. The widest within-model spread it found was 29.8 points.
Now put that next to what the leaderboard exists for. The entire top thirty of SWE-bench Verified spans 8.8 points.
A spread only breaks a ranking if it is uneven, and the paper does not say which models swapped places. What it publishes instead is worse for the leaderboard.
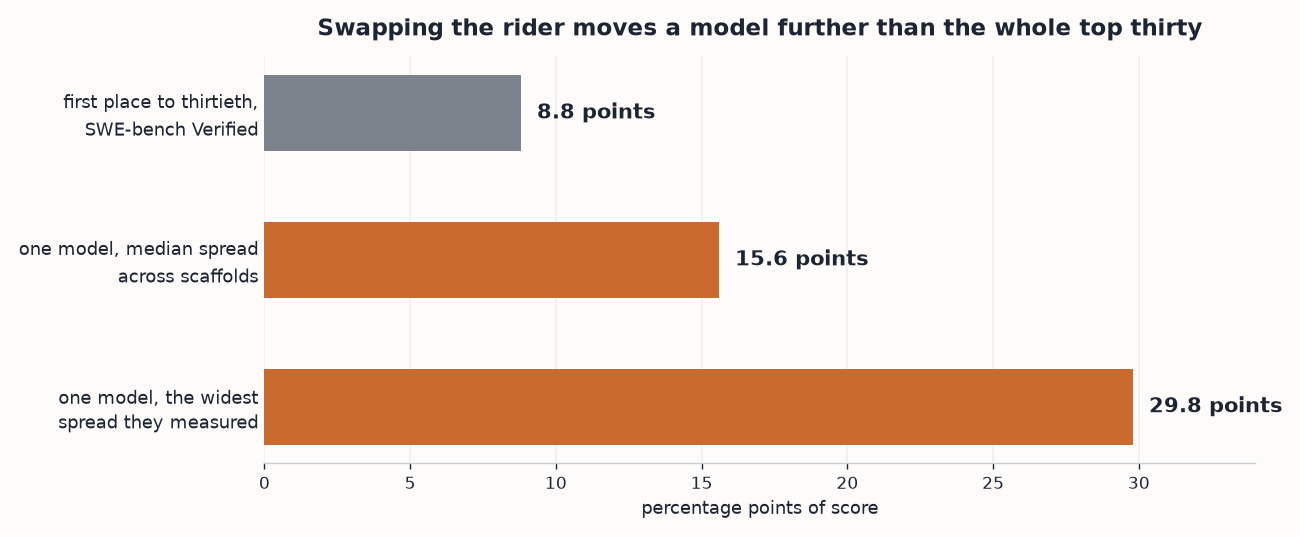 Figure 3: the grey bar is the whole race. The orange bars are one model changing its clothes. Source: Author
The top agents solve the same 285 of the 500 instances and fail the same 51, and the better ones mostly solve a superset of what the worse ones solve rather than solving different problems. Then an exact paired McNemar test, the right test when two systems are judged on the same items, separates none of the 29 adjacent pairs in the top thirty at $\alpha = 0.05$. Neighbours on that board are statistically tied, all the way up, which is why the paper’s own title says the leaderboard can no longer order its top entries.
Then there is the ground jury. The Double Measurement Confound in Agent Benchmarks, from the same month, names two failures that arrive together. The scaffold makes the decisions that decide the outcome (retry, pagination, deduplication, submission) instead of the model. And the scorer grades the shape of the output rather than comparing the submitted values against a known answer. That is the ComtradeBench result from the top of this post, where a set of fabricated records scored exactly as well as the correct set.
Models are like young horses here, and I mean that kindly. Put a good rider up and they look like they have been doing this for years. Put a bad one up and they will find the one fence with a flapping tarpaulin under it and decide it is a bin lorry.
The sport’s answer to all this is old and boring: the results sheet carries both names. Agent leaderboards carry one.
Meanwhile the riders are being trained too. HARBOR, out of JP Morgan in April 2026, treats scaffold configuration as a machine learning problem in its own right. It runs constrained Bayesian optimisation over the flags (context compaction, tool caching, trajectory reuse, speculative tool prediction). Which tells you roughly how much money there is in getting the rider right.
Going clear eight times
One clear round is a nice afternoon. Four clear rounds over two days is a Nations Cup, and it is a different question about the same pair.
τ-bench put that question into its scoring, and I think it is the best idea in any of these benchmarks. Instead of an average pass rate it reports pass^k: the chance that the same task is solved on all $k$ attempts, averaged over the tasks. In words, the chance of going clear $k$ times in a row:
\[\text{pass}^k = \text{average over tasks of } (\text{that task's success rate})^k\]specifically,
\[\text{pass}^k = \frac{1}{\vert T \vert} \sum_{t \in T} p_t^{\,k}\]where $T$ is the set of tasks, $\vert T \vert$ is how many tasks there are, and $p_t$ is the probability of solving task $t$ on a single attempt. In practice $p_t$ is estimated by running every task several times, which is why this costs more to measure than a mean. Note also that this is the average of the powers and not the power of the average, and that difference is the point of the whole metric.
Let’s do one by hand. The paper’s best GPT-4o agent scored a bit over 60% at pass^1 on the retail domain, and it reports pass^8 below 25%. Now suppose every task were the same independent coin at $p = 0.61$. Then pass^8 would be $0.61^8 = 0.019$, so under 2%. The paper gives 25% as a bound rather than a figure, so I cannot tell you the exact multiple. But a uniform agent falls off a cliff to 2% by the eighth round, and this one did not. So the 61% is not spread evenly over the tasks. A big share of it comes from tasks the agent gets right nearly every time, and the rest from tasks it almost never gets (that reading is mine, not the paper’s).
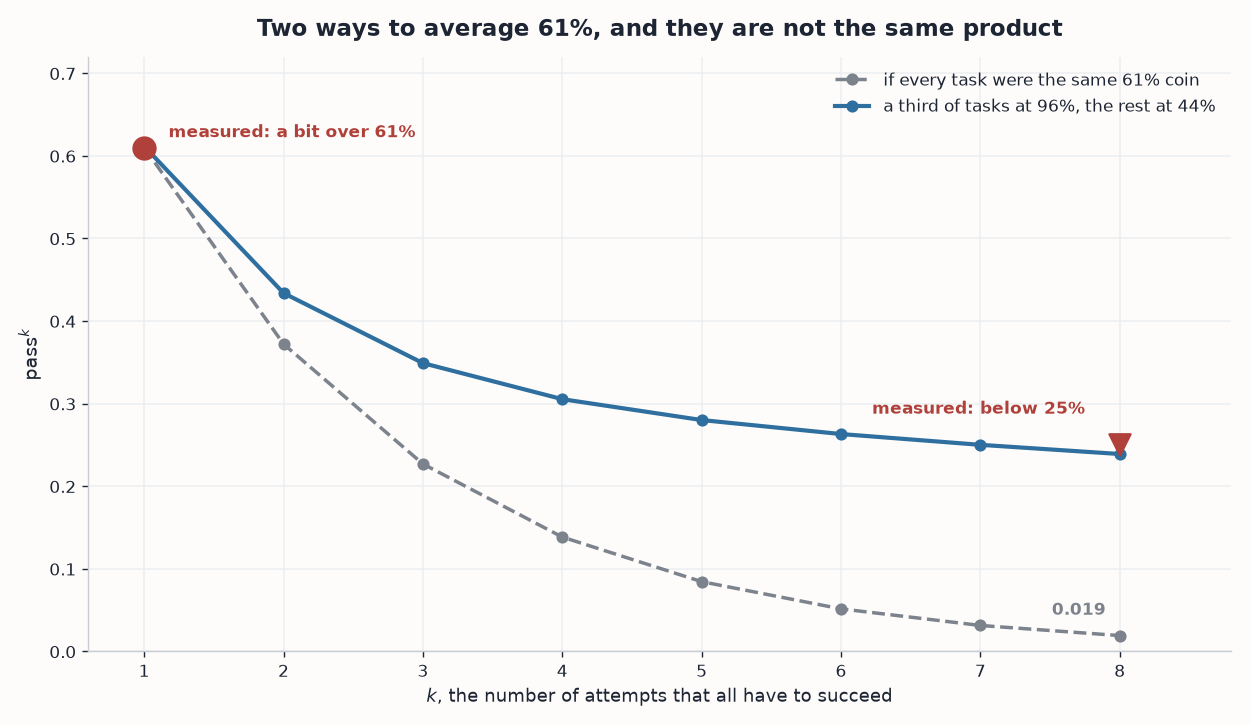 Figure 4: the grey curve is what pass^8 would be if every task were the same coin. The blue curve is one mixture that hits both measured points, and there are many others. Either way, fewer than one task in four survives eight attempts. Source: Author
That is far more useful than the mean, and it is the number I would want before putting an agent anywhere near a customer.
The ground is part of the test
A jumping round on deep, wet footing is a different test from the same course on good ground, and every rider in the warm-up ring knows it. A real slice of an agent’s score belongs to the benchmark’s own construction.
Terminal-Bench 2.1 is a revision of 2.0 that fixes 28 of the 89 tasks, so nearly a third of the course was rebuilt between two versions of the same benchmark. SWE-bench Verified exists for the same reason, since only 500 of the original 2,294 tasks came through human inspection clean. OSWorld shipped a verified pass of its own in July 2025, and the scores moved when it landed.
None of that is anybody behaving badly. Building containerised tasks that break for exactly the right reason is genuinely hard work (one container is, at a guess, a day’s work, and Terminal-Bench has 89 of them). But it does mean that when a score jumps five points, your first question should be whether the model changed or the course did.
Where things are going
Four things I would put money on.
- Print the provenance on the sheet. The converged-agents paper asks for what the sport already does: record the model and the scaffold as a pair, and publish tiers rather than ranks when the statistics cannot separate two entries.
- Report the tails, not just the mean. That means pass^k, the worst case across tasks, and the variance over repeated runs. A mean hides the shape of the failures, and the shape is what a deployment decision turns on.
- Measure length instead of accuracy. METR’s time horizon is a better axis than a percentage because it does not saturate. A test that tops out at 100% stops moving; a duration keeps going up.
- Build a fresh course every year. Held-out sets, and benchmarks made from things that happened after the training cut-off. GSM1k is the template, and it costs real human effort every single year.
Faults and eliminations
My own argument cuts against me, and that should go first. If the scaffold moves a score by 15 points, then the scaffold is part of what you are buying, because nobody runs a bare model in production. So a benchmark that strips the scaffold away to isolate the model would be measuring a thing nobody ships, and the pair-score everybody complains about may be closer to what a buyer needs. Which leaves me with a smaller claim. Scoring the pair is right, and the sheet should carry both names.
The convergence at the top of SWE-bench might also be real rather than a measurement problem. Solving the same 285 of 500 fits a leaderboard that cannot tell its entries apart. It fits just as well a world where the other 215 need something none of these agents has, in which case the leaderboard is reporting the truth and the truth is dull.
Private and held-out benchmarks fix contamination by giving up reproducibility. If I cannot see the questions then I cannot check the grader. And I am back to trusting a vendor’s number, which is where the Jev post got stuck.
My neat split between sheets and courses also leaks. A reasoning model’s score on a question sheet depends on how long it was allowed to think and what it was allowed to call, so those numbers are quietly pair-scores too.
METR’s curve needs a caveat too. The doubling time is fitted to a task set METR wrote, scored against human timings METR collected, with a handful of models per year. That is a strong result about those tasks and a weaker one about AI in general.
Two of the papers here are three weeks old, and I have read them through their abstracts and secondary write-ups rather than end to end. The 96.8 against 97.5, and the 15.6 and 29.8 point spreads, all come from those two. Those are the numbers I would most like a second source for.
Conclusion
The famous tests did their job and then got answered. MMLU ran the field for four years, and the top of it now sits in its own label errors. GSM8K and HumanEval are finished, and the harder sheets written to replace them are being learnt at roughly eighteen months each. Writing a new one takes about that long, so the people making these tests are barely keeping ahead.
What replaced them is a course rather than a sheet, and a course needs a rider. So the number on the leaderboard belongs to a pair, and the paper that measured it found the rider worth more than the gap between first place and thirtieth. Then somebody sent a script with no model in it round the same course, and it went clear.
My bet is that within a year, the leaderboards people make real decisions from will print two names and a tier. A results sheet at a horse show has done that for a century. And the first lab to publish its scaffold’s config next to its model card will get taken more seriously than the one with the taller bar.
The horse never walks the course, and nobody ever asks it to. So put the rider’s name on the sheet, the way every show in the world already does, and then we can go back to arguing about the horse.
And now you know. Fin.